Fibonacci in Trading: Retracements and Extensions Explained
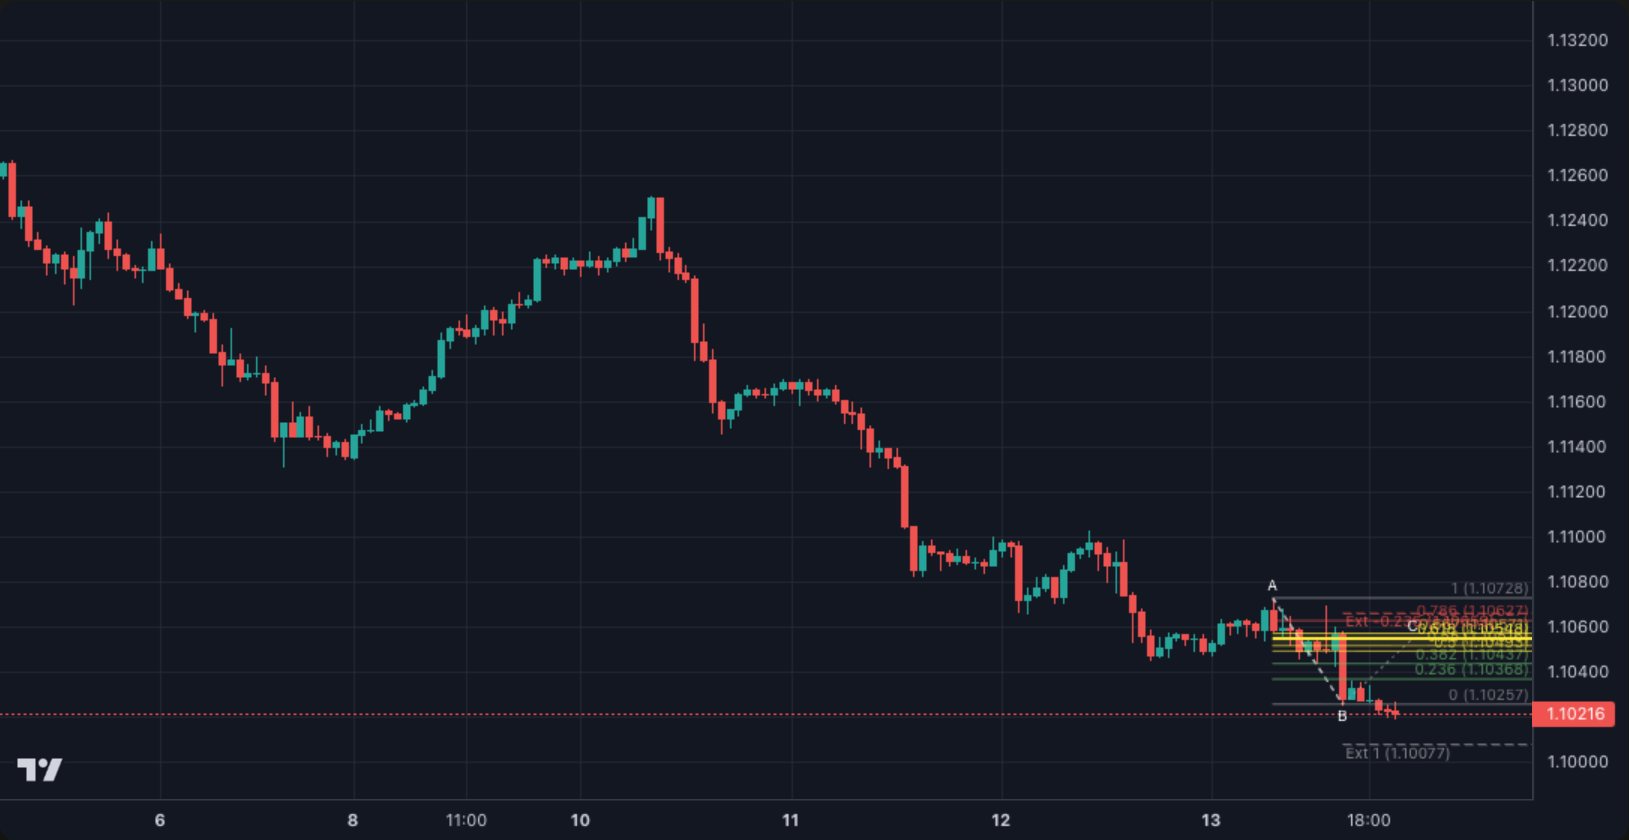
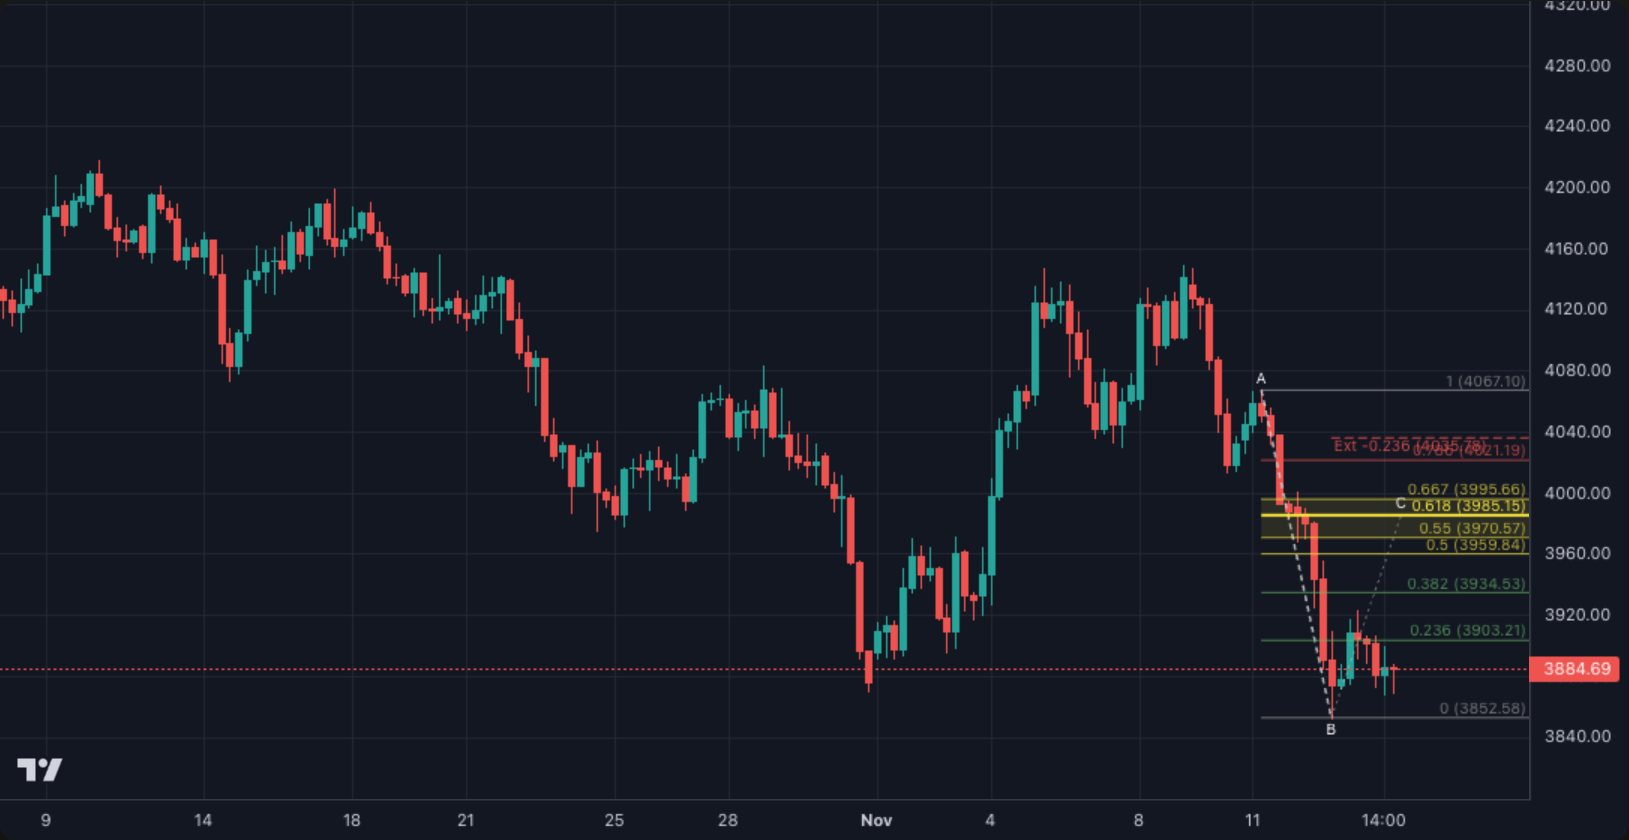
Fibonacci in trading draws horizontal levels between a low and a high (or the reverse) at ratios from the Fibonacci sequence, chiefly 0.382, 0.5, 0.618 and 0.786. Retracement levels suggest where a pullback may end before the trend resumes; extensions such as 1.618 and 2 set targets.
How to draw it
- In an uptrend: click the low that started the move and drag to the high.
- In a downtrend: from the high to the low.
- Use a clear impulse that broke structure, not a random swing.
The key levels
- 0.5: the middle of the move; above it is premium, below it discount.
- 0.618 – 0.786: the healthy deep pullback zone (optimal trade entry).
- SK zone, 0.55 – 0.667: the area the SK method focuses on.
- 1.618 and 2: extension targets after the high breaks.
Common mistakes
- Drawing on tiny swings, so the levels change every hour.
- Buying every level without waiting for price to react.
Frequently asked questions
Which Fibonacci level is best for entries?
The 0.618 – 0.786 zone is the classic healthy pullback, especially when it lines up with an order block or fair value gap.
Retracement vs extension?
Retracements measure the pullback inside the move (0 to 1); extensions measure beyond the high (above 1) for targets.
Does Go2Forex draw Fibonacci automatically?
Yes, the SK Fibonacci button on every pair's chart draws the latest impulse with retracement and extension levels.
For education only, not investment advice. Trading leveraged products carries a high risk of losing your capital.