Price Action Trading Explained: Trading the Chart Itself
Price action trading means reading price movement on the chart itself, without indicators: you take the trend from highs and lows, mark support and resistance, then wait for a candlestick or chart-pattern signal at those levels before entering.
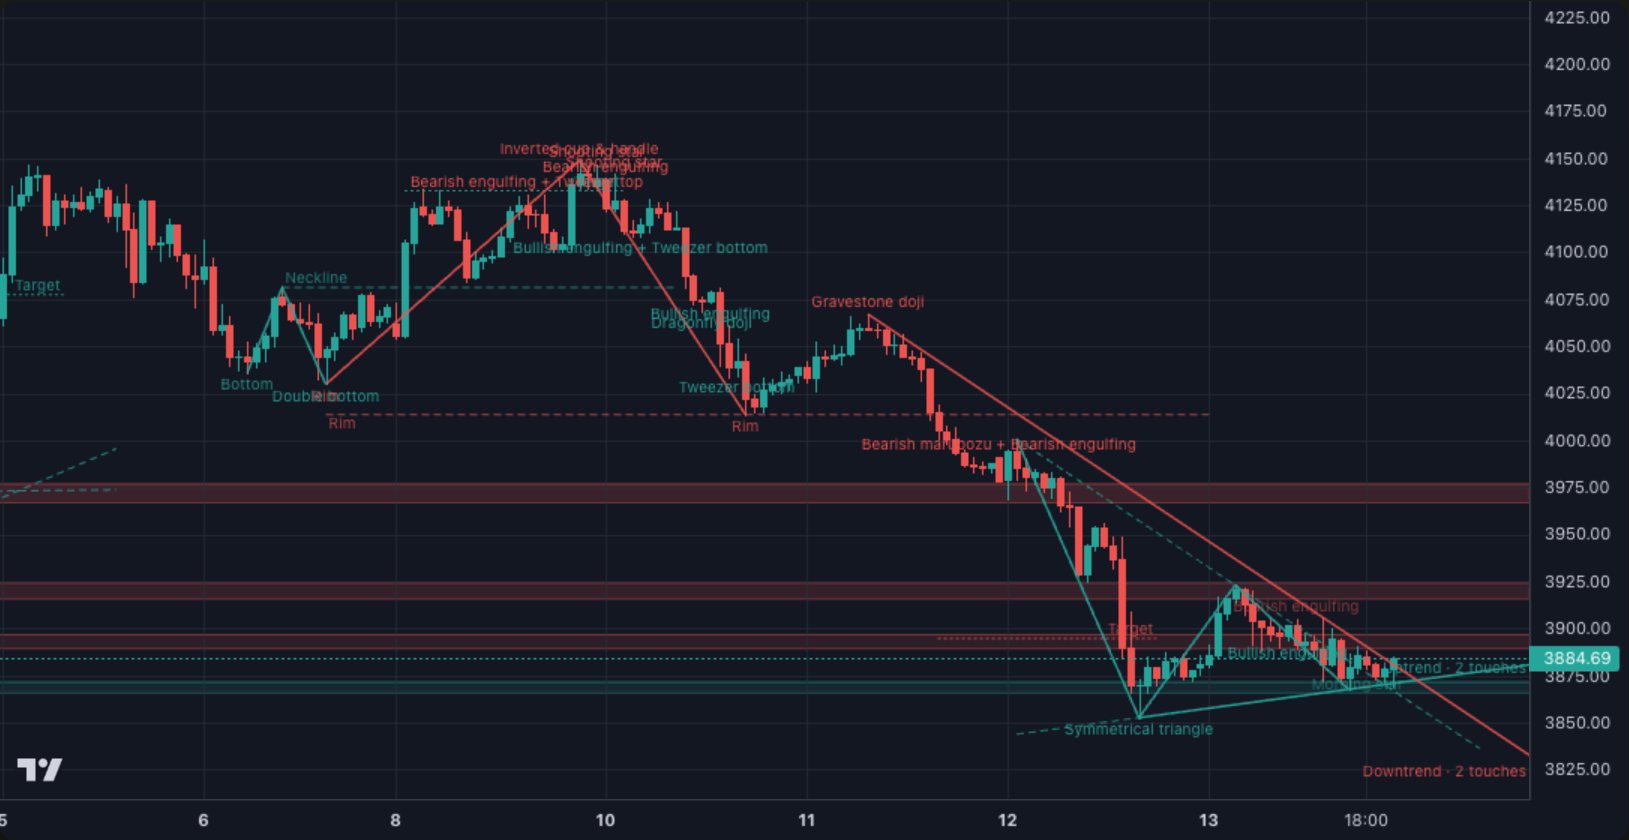
The building blocks
- Trend: higher highs and lows up, lower highs and lows down, a range in between.
- Support and resistance: levels price has turned at more than once.
- Reversal candles: hammer and pin bar, engulfing, doji, morning and evening star.
- Chart patterns: double top and bottom, head and shoulders, triangles, flags.
A simple entry plan
- Start with context: the higher-timeframe trend and a nearby key level.
- Wait for a signal candle at the level in the trend's direction (e.g. a bullish engulfing at support).
- Enter on a break of the signal candle's high, stop below its low.
- Target the next level, at no less than twice the risk.
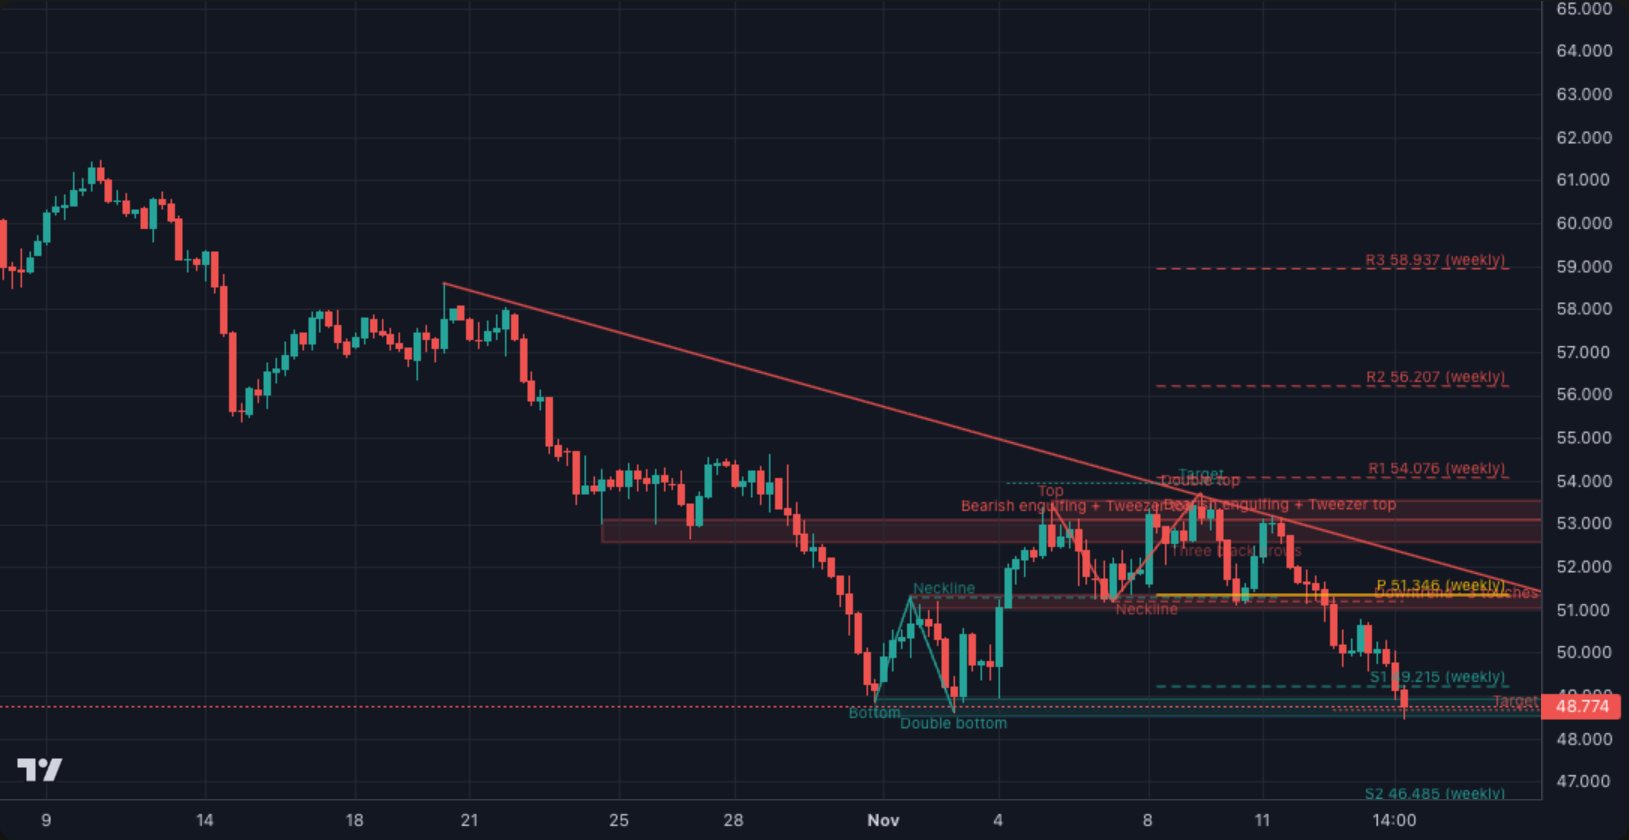
Common mistakes
- Trading a nice candle in the middle of a move, far from any level.
- Ignoring the higher timeframe and overtrading noisy small timeframes.
- Entering before the signal candle has closed.
Frequently asked questions
Price action vs Smart Money Concepts?
SMC is an advanced branch of price action that explains moves by institutional behaviour (liquidity, order blocks); classic price action works with levels, candles and patterns.
Which candlestick patterns matter most?
Pin bars (hammer and shooting star), engulfing candles, inside bars, and morning and evening stars, and only when they form at a clear level.
Does Go2Forex draw patterns and candles automatically?
Yes, the Classic patterns and candlesticks button draws support and resistance zones, trend lines, chart patterns and candlestick signals on the chart.
For education only, not investment advice. Trading leveraged products carries a high risk of losing your capital.